For investment professionals

Institutional-grade model portfolios. Without the basis points.

15 systematic equity and ETF models built on the alternative data hedge funds license: earnings-call language, estimate revisions, innovation activity. Every holding published, rebalanced monthly, for one flat annual fee.

No credit card. Full access to every model for 30 days.

app.sharpemetrix.com/models

Model Portfolios

Since inception · ann.

Model Return Excess
Small Cap Edge 30 Russell 2000 · 29 holdings 19.8% +9.3%
Small Cap Edge 50 Russell 2000 · 49 holdings 19.8% +9.3%
PowerList™ - (100) Unconstrained Russell 2000 · 99 holdings 19.7% +9.1%
Small Cap Value Edge Russell 2000 · 39 holdings 19.6% +9.1%
Core Alpha 30 Russell 1000 · 29 holdings 19.9% +8.0%
model portfolios, equity & sector ETF
15
model portfolios, equity & sector ETF
of year-by-year history, since 2008
18 yrs
of year-by-year history, since 2008
signal families per stock, 3 from alternative data
7
signal families per stock, 3 from alternative data
flat annual fee, whatever your AUM
0 bps
flat annual fee, whatever your AUM

See it in 45 seconds

The platform, start to finish, in under a minute.

Models, the Power List and the research tools, the way an advisor uses them. No sign-up needed to watch.

Why it matters

Most model shelves are built from the same public factors. The edge is in the data underneath.

Value, momentum and quality are now available in every ETF wrapper. They are useful, and they are crowded. The signals institutional managers pay for, such as what management says on the earnings call or which analysts actually get estimates right, have been out of reach for most advisory practices.

  1. 01

    Better inputs

    Each stock is scored on seven signal families, three of them from alternative datasets licensed by hedge funds and asset managers.

  2. 02

    Rules, not opinions

    Portfolios are built by the same rules every month. No discretionary overrides, no style drift, and nothing your compliance team can't read.

  3. 03

    Advisor economics

    A flat annual fee instead of basis points, so the cost of the research doesn't grow with your book or come out of client returns.

Evidence, not adjectives

Every model. Every year. Including the ones we lagged.

Pick any of the 15 models to see what it holds and its full calendar-year record against its benchmark. It's the same view you get inside the platform.

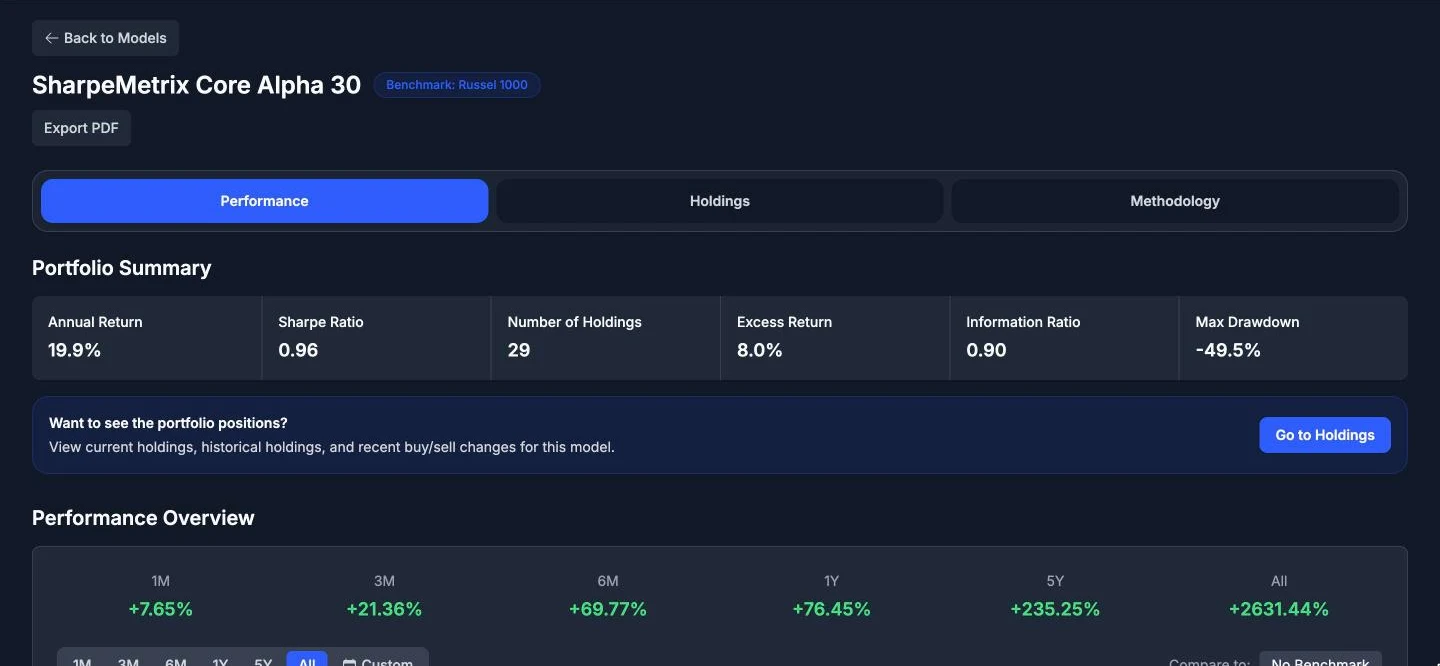
Core Alpha 30

30 large caps from the Russell 1000 with the strongest composite, led by the alternative-data signals.

Universe
Russell 1000
Holdings
29
Ann. return
19.9%
Excess
+8.0%
Sharpe
0.96

Since 2008, ahead of its benchmark in 13 of 18 full calendar years. The latest nine, unedited:

Year Model Russell 1000 Excess
2018 -4.7% -4.9% +0.1%
2019 +33.9% +31.1% +2.9%
2020 +16.5% +20.8% -4.3%
2021 +30.0% +26.3% +3.7%
2022 -7.7% -19.2% +11.5%
2023 +34.5% +26.4% +8.1%
2024 +22.5% +24.3% -1.8%
2025 +14.7% +17.2% -2.5%
2026YTD +77.2% +13.4% +63.8%
Since 2008 ann. 19.9% 11.8% +8.0%

Growth of $10,000

2008–2026 · log scale

Model $273k Russell 1000 $73k
$10k $25k $50k $100k $250k 20082012201620202024

The full model shelf

Annualized since inception. Excess return is versus each model's stated benchmark.

All model pages →
Model Universe Holdings Ann. return Excess Sharpe Max DD Months ahead
Equity models
Small Cap Edge 30 Russell 2000 29 19.8% +9.3% 0.87 -40.1% 62%
Small Cap Edge 50 Russell 2000 49 19.8% +9.3% 0.89 -40.7% 65%
PowerList™ - (100) Unconstrained Russell 2000 99 19.7% +9.1% 0.90 -38.5% 70%
Small Cap Value Edge Russell 2000 39 19.6% +9.1% 0.69 -45.2% 54%
Core Alpha 30 Russell 1000 29 19.9% +8.0% 0.96 -49.5% 60%
PowerList™ - (100) Sector Aligned Russell 3000 99 18.5% +8.0% 0.84 -42.0% 69%
Core Alpha 50 Russell 1000 49 18.6% +6.8% 0.96 -43.1% 63%
Large Cap 30 S&P 500 29 18.2% +5.9% 0.95 -43.2% 59%
Large Cap 50 S&P 500 49 17.5% +5.2% 0.96 -41.6% 61%
Russell 1000 Momentum Russell 1000 39 16.7% +4.8% 0.78 -53.0% 54%
Large Cap Earnings S&P 500 39 13.8% +1.4% 0.73 -47.7% 54%
Sector ETF models
SPDR Equal Factor 3 Sector ETFs 3 15.3% +1.7% 0.97 -28.4% 57%
SPDR Factor Advantage 3 Sector ETFs 3 15.1% +1.5% 0.96 -28.1% 56%
iShares Factor Advantage 7 Sector ETFs 7 13.0% +2.7% 0.73 -64.2% 60%
iShares Equal Factor 7 Sector ETFs 7 12.9% +2.6% 0.73 -64.4% 60%

Max DD is the largest peak-to-trough decline. Months ahead is the share of months the model beat its benchmark. Past performance does not predict future results. Full disclosures.

Your process. Our research.

Use it as your model shelf, your research desk, or both.

Turnkey

Run the models as-is

Pick a model, follow the monthly trades. Holdings, weights and client-ready factsheets are ready to go.

Browse the models →

Blended

Feed your own process

Use the Power List and component scores to source ideas, check existing holdings and support your own portfolio decisions.

See the Power List →

Enterprise

Put it on your platform

License strategies for a firm-wide shelf, a TAMP or a model marketplace, with holdings files delivered every month.

Talk to us →

The platform

Everything behind a model, one click away.

Model portfolios

11 equity models across large, small and all-cap universes, plus 4 sector-ETF rotation models. Each comes with its full history, risk statistics and methodology.

  • Performance vs. benchmark over any window
  • Current holdings, historical holdings and every trade
  • Sector and factor exposures
  • One-click PDF for client and committee meetings
SharpeMetrix Core Alpha 30 model detail in the SharpeMetrix platform

Power List™ · top of the list

as of November 2, 2026

Ticker Sector Signal Earn. Transcr. Innov. Quality
Commercial Services 100 99977096
Technology 100 91998096
Consumer Discretionary 100 848982100
Technology 100 99859398
Technology 100 94987192
Technology 100 98929069

Power List™

Every month we score the Russell 3000 on seven signal families and publish the top of the list, with the score behind every name. Use it to source ideas, sanity-check holdings, or build your own portfolios.

  • Composite signal plus seven component scores
  • Rank changes month over month
  • Filter by sector and export to CSV or PDF

Tickers hidden; the full list is available in the platform. Scores shown for illustration only and not a recommendation to buy or sell any security.

Research & screening

Open any stock to see the scores behind its rank, or screen the universe on any mix of signals.

Watchlists & analysis

Load a client's current holdings and see how they score, where the sector bets are, and what's weakening.

AI research assistant

Beta

Ask the rankings questions in plain English and get answers grounded in our scores.

Product views are illustrative; tickers are hidden.

Rebalance day

Once a month. Minutes, not a weekend.

  1. 01

    Signals refresh

    Every stock re-scored on all seven signals.

  2. 02

    Trades published

    Buys, sells and new weights for every model.

  3. 03

    You implement

    Export to your custodian or rebalancer, on your schedule.

Core Alpha 30 · Recent Changes

Rebalance Tuesday, December 1, 2026

Buys 4 Sells 4 Holds 25
Ticker Action Prev. wt New wt Change Signal
Buy 0.0% 3.6% +3.6% 97
Buy 0.0% 3.4% +3.4% 95
Sell 3.3% 0.0% -3.3% 54
Sell 2.9% 0.0% -2.9% 48
Hold 3.8% 4.2% +0.4% 99
Hold 3.5% 3.1% -0.4% 88
Hold 3.4% 3.6% +0.2% 93
Hold 3.2% 3.0% -0.2% 81
Export CSVExport PDFFactsheet

Inbox

Dec 1

Rebalance ready: December trades for your models

From SharpeMetrix

Good morning. This month's signals are in and your followed models have rebalanced.

ModelBuysSellsTurnover
Small Cap Edge 30 4 4 22%
Small Cap Edge 50 6 6 19%
PowerList™ - (100) Unconstrained 3 3 15%
csv trades_2026-12.csv
pdf factsheets_2026-12.pdf
Review trades

Illustrative. Trade counts and weights shown are examples, not a live rebalance.

How it works

Seven signals. One set of rules. Every month.

Each stock gets a 0–100 score on every signal. Scores combine into a monthly composite, and portfolios are built from the composite under fixed risk limits on position size, sector weight and turnover.

  1. Collect

    Fundamental, price and alternative datasets, point-in-time

  2. Score

    Seven signal families, 0–100, sector-relative

  3. Construct

    Rules-based selection with position and turnover limits

  4. Publish

    Holdings, trades and analytics at each monthly rebalance

Read the full methodology →

Earnings

Alternative

Forward earnings momentum and estimate revisions, weighted by forecaster accuracy.

Transcripts

Alternative

Language and tone of management on earnings calls, scored with NLP.

Innovation

Alternative

Patent filings and skilled-hiring (H1B) data as lead indicators of future growth.

Momentum

Quant

Price strength measured against true economic peers, not just GICS codes.

Value

Quant

Cheapness on earnings, cash flow and enterprise value, sector-relative.

Quality

Quant

Profitability, balance-sheet strength and earnings stability.

Low Volatility

Quant

Quality-adjusted volatility to control drawdown and position risk.

Composite

The monthly signal that drives Power List rank and model selection.

Who we serve

Built for advisors. Ready for the home office.

Independent RIAs & advisors

Turnkey models without a TAMP's basis points.

  • Holdings, weights and monthly trades for every model
  • Client-ready PDF factsheets
  • Flat annual fee, no AUM minimums
How RIAs use SharpeMetrix

Wealth management firms

One consistent model shelf across every advisor.

  • Firm-wide access and shared watchlists
  • Documented methodology for the investment committee
  • Monthly rebalance calendar your ops team can plan around
For wealth firms →

Broker-dealers & home offices

Third-party models your due diligence team can actually diligence.

  • Year-by-year history for each model
  • Rules-based construction, no discretionary overrides
  • Full holdings transparency and turnover data
For broker-dealers →

TAMPs & model marketplaces

Differentiated strategies for your platform shelf.

  • Strategy licensing and model delivery
  • Equity and sector-ETF strategies across cap ranges
  • Monthly holdings files on a fixed schedule
For tamps & platforms →

Asset managers & institutions

Alternative-data rankings as an input to your own process.

  • Russell 3000 component scores, monthly
  • Screening and export on every signal
  • Research support from a quant data team
For asset managers →

The economics

Your book grows. Your research bill doesn't.

Model providers and TAMPs typically charge a share of assets for the strategy layer. That cost compounds against your clients every year. SharpeMetrix is a flat annual subscription.

Compare against TAMP pricing →
$100M

Strategy fee at 25 bps / yr

$250,000

SharpeMetrix

Flat fee

Illustrative strategy-layer fee only; actual third-party pricing varies. Excludes custody, trading and advisory fees.

Who's behind it

Built by people who've sold data and models to institutions for two decades.

Our team has built portfolio, data and research products at firms including Bloomberg, RBC, CIBC, AlphaSense and Liquidnet, and now brings that work to advisory practices.

Meet the team →

Common questions

Why show every calendar year?

Because a single since-inception number hides a lot. Each model's history goes back to 2008, year by year against its benchmark, including the years it trailed, so you can judge consistency for yourself. In the platform we walk through how each model was built and tested.

How often do the models rebalance?

Monthly. Signals refresh at the start of each month and the platform shows the resulting buys, sells and weight changes for every model, so you can implement on your own custodian and schedule.

Can I see every holding?

Yes. Current holdings, historical holdings and every trade are visible for each model, and each stock shows the component scores behind its ranking.

How is SharpeMetrix priced?

A flat subscription, not a percentage of assets: $1,500 per quarter or $4,499 per year. Firm, platform and data-licensing terms are quoted separately.

Is SharpeMetrix an investment adviser?

No. SharpeMetrix is a publisher of impersonal investment models and research for investment professionals. Advisors remain responsible for suitability and implementation for their clients.

All questions →

See it with your own book

Every model, every holding, every trade. Open for 30 days.

Full platform access with no credit card. Or book a 20-minute walkthrough and we'll map the models to your current lineup.