Save $50,000+ Annually on Your Practice
Access institutional-grade portfolio management powered by proprietary alternative data—without the basis points. Most advisors save over $50,000 per year switching to SharpeMetrix's flat-fee model.

Access institutional-grade portfolio management powered by proprietary alternative data—without the basis points. Most advisors save over $50,000 per year switching to SharpeMetrix's flat-fee model.

Most TAMPs and SMAs charge 0.35% to 0.75% in basis points annually. Calculate your potential savings with flat-fee pricing.
Industry standard: 35-75 basis points (0.35% - 0.75%)
That represents 97% in cost savings
Scale Your Practice With Predictable Costs
Access the same institutional-quality data and systematic portfolio management used by the world's largest asset managers—without the traditional basis point fees that limit your growth and profitability.
Deploy sophisticated, systematically managed portfolios powered by institutional-grade alternative data. Focus on growing your practice while we handle research, rebalancing, and portfolio management.
Access proprietary alternative data from earnings calls, patent filings, and visa trends—the same signals used by billion-dollar hedge funds—for screening, filtering, and generating differentiated investment ideas.
Powerful Data, Simplified Interface
Explore model performance, dive into rankings, and analyze portfolio changes with our enterprise-grade platform designed specifically for financial advisors.

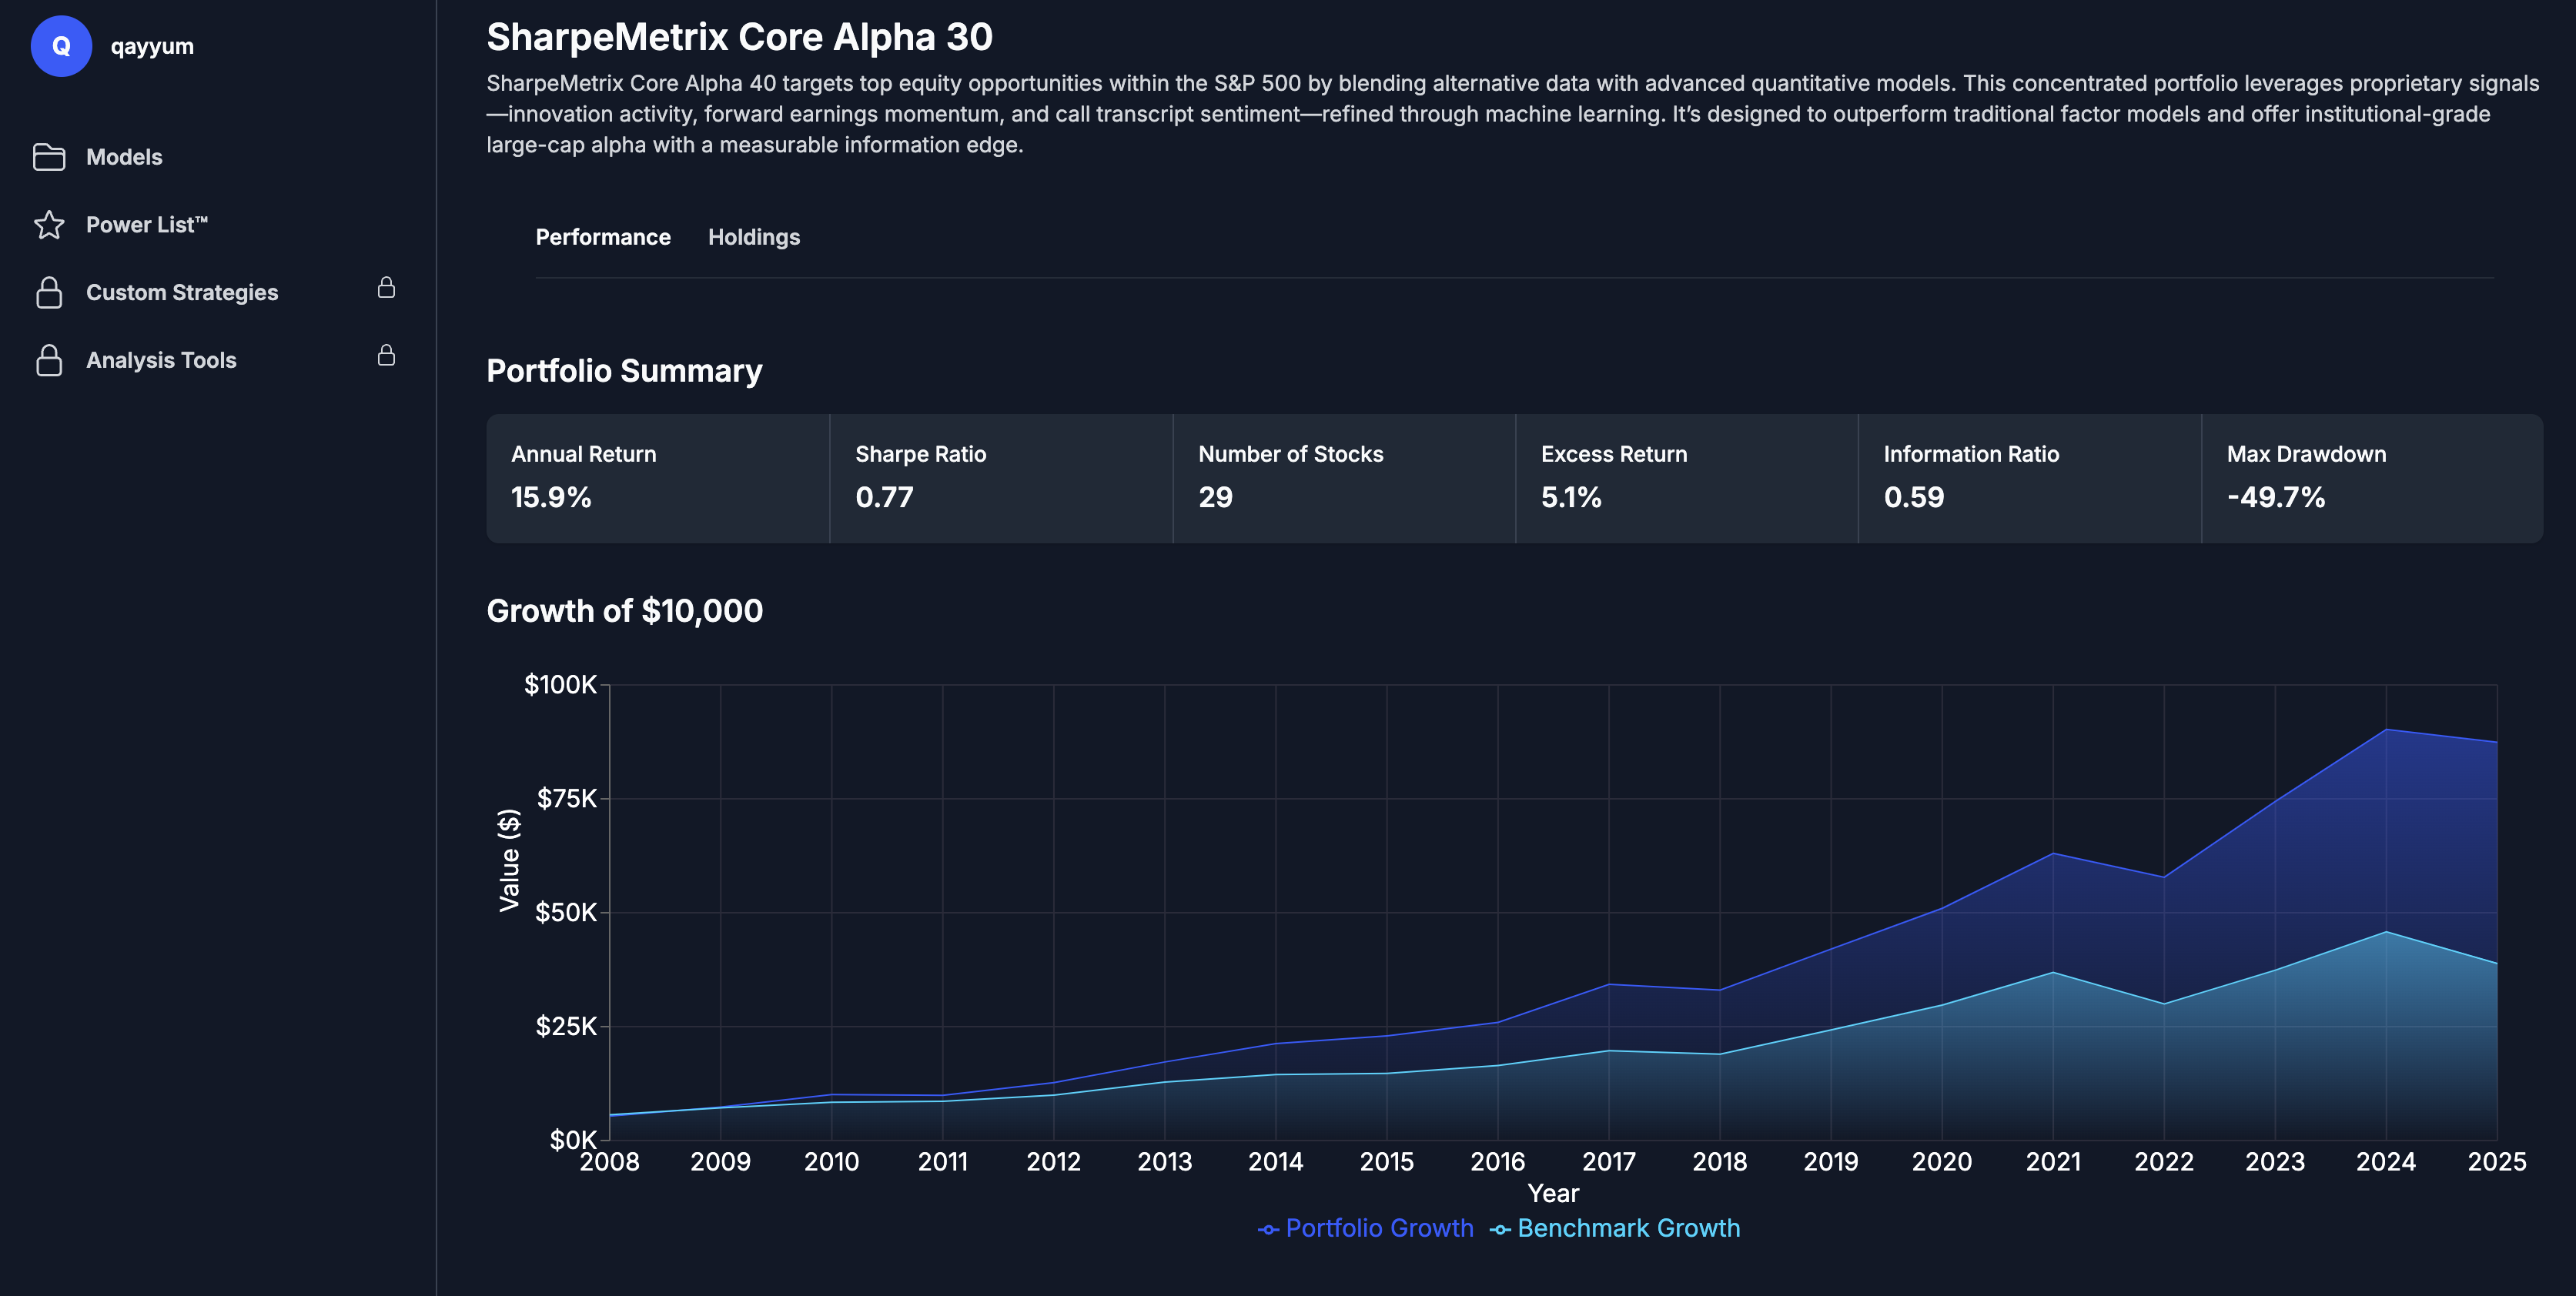
Track overall model performance metrics.

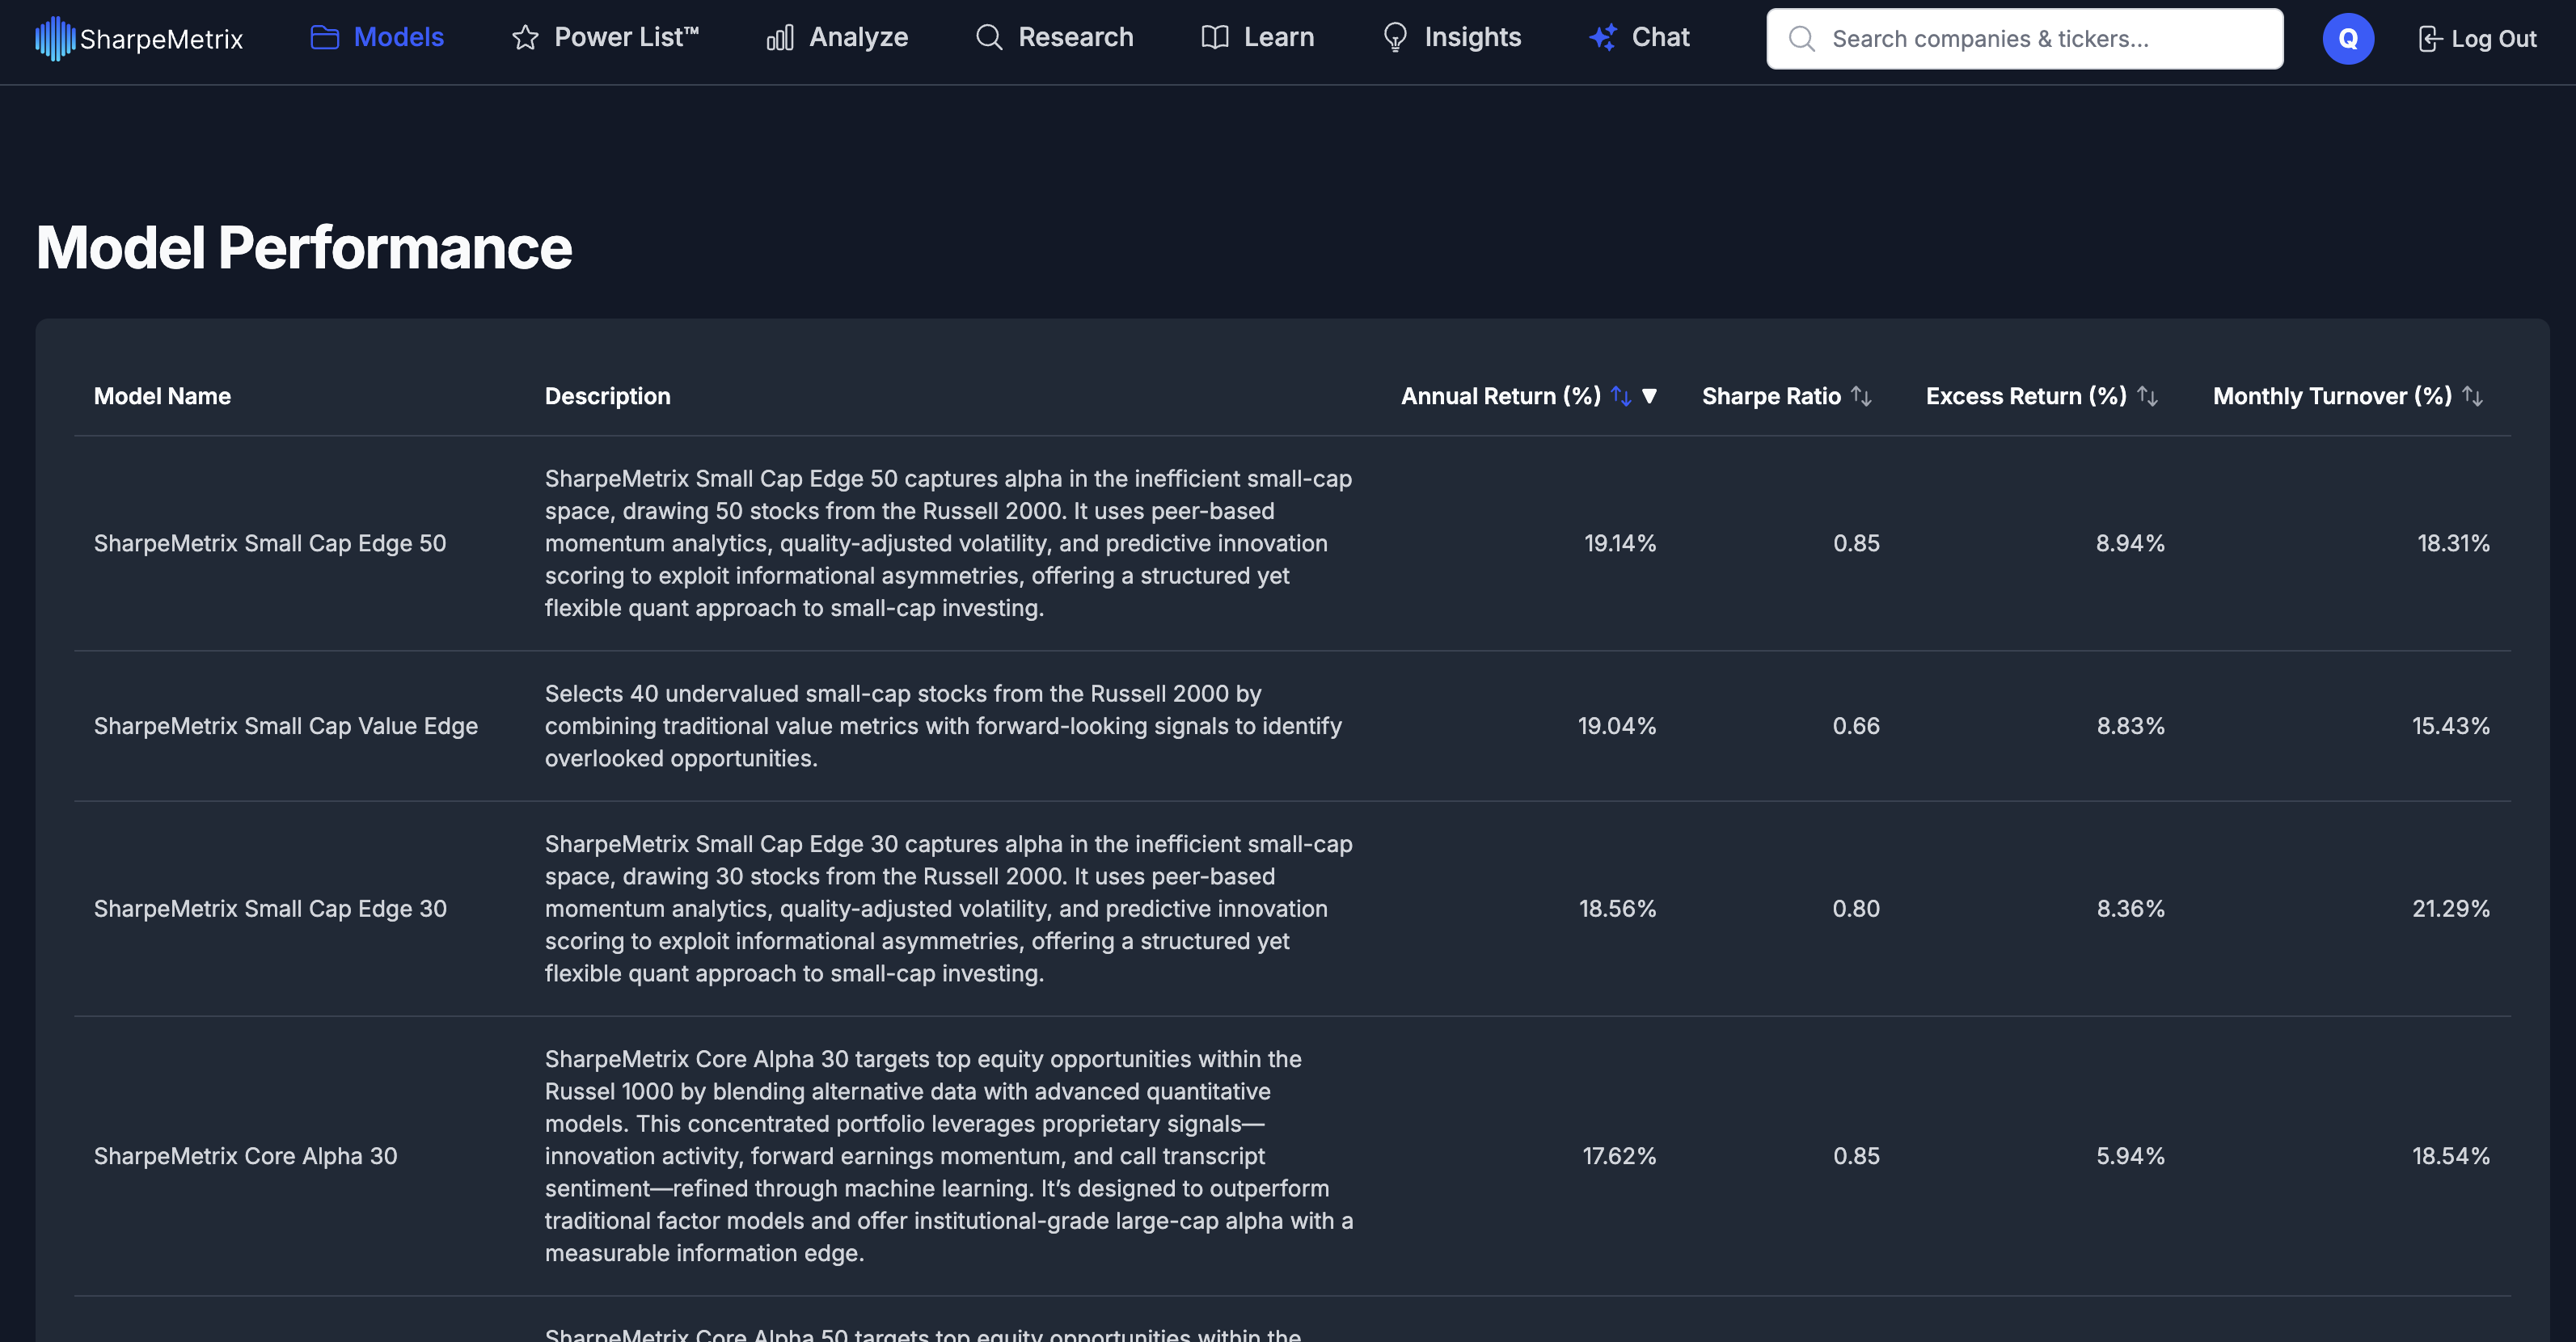
Analyze detailed model performance and characteristics.

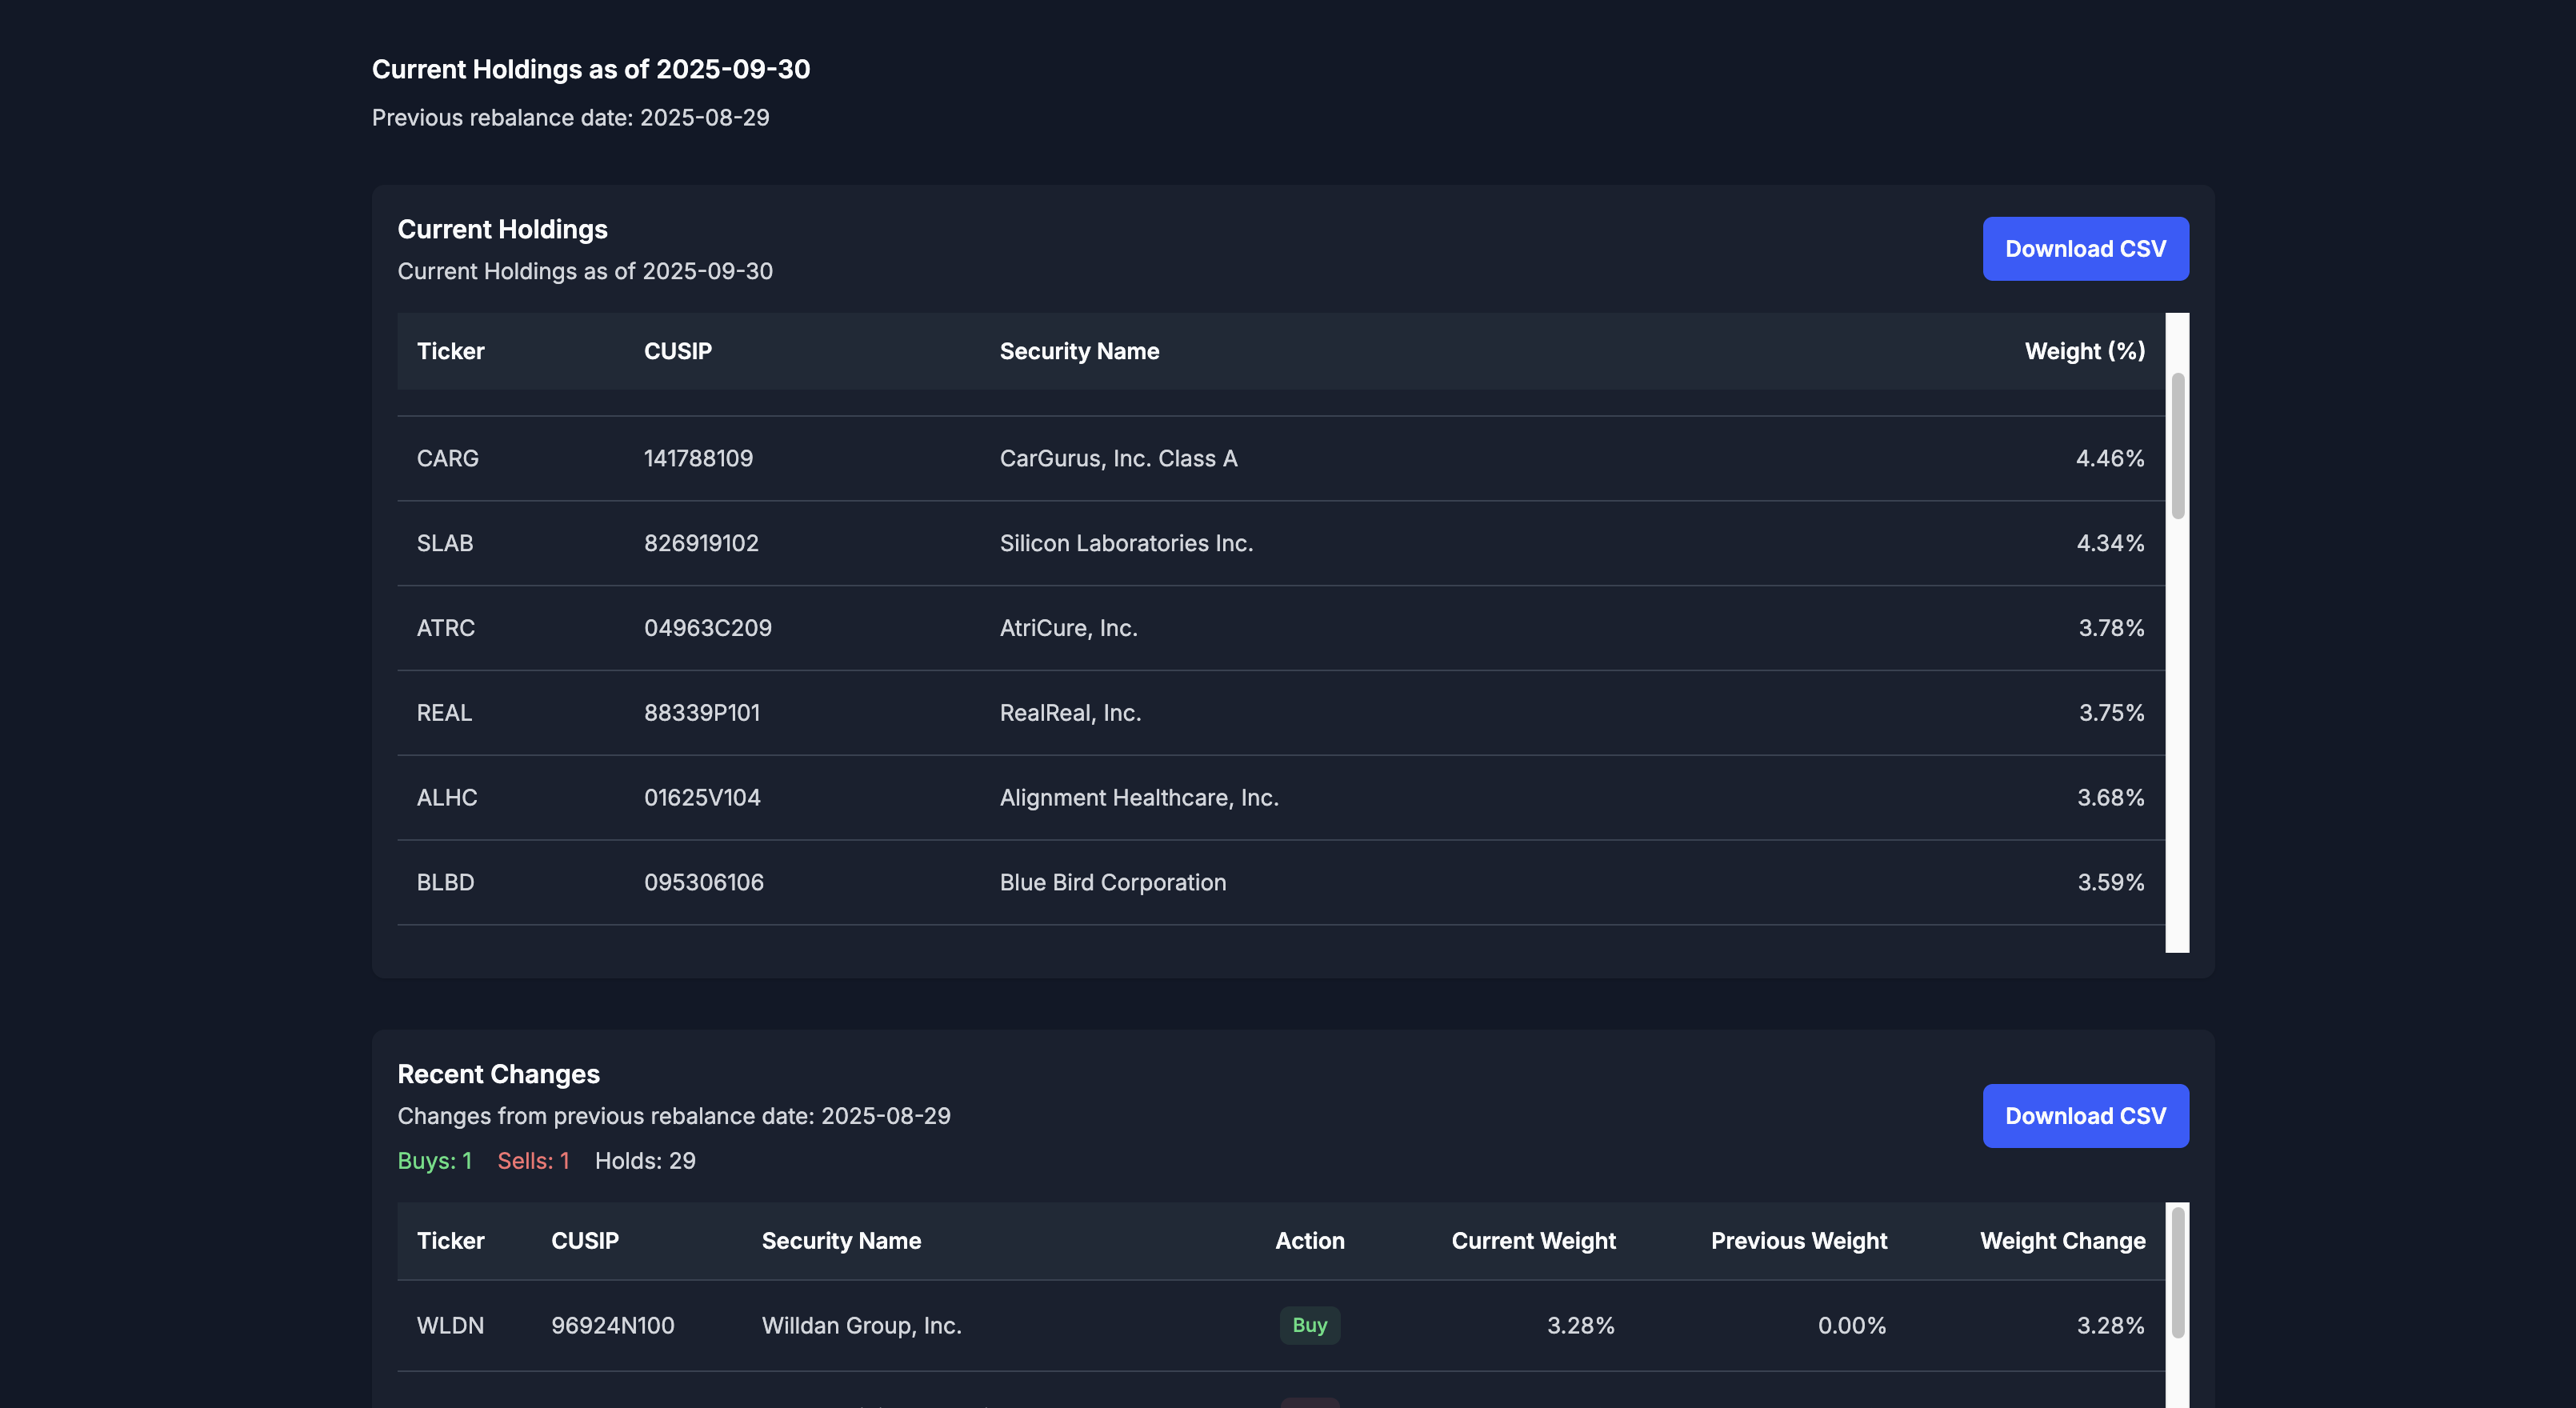
Analyze recent portfolio changes and trades.

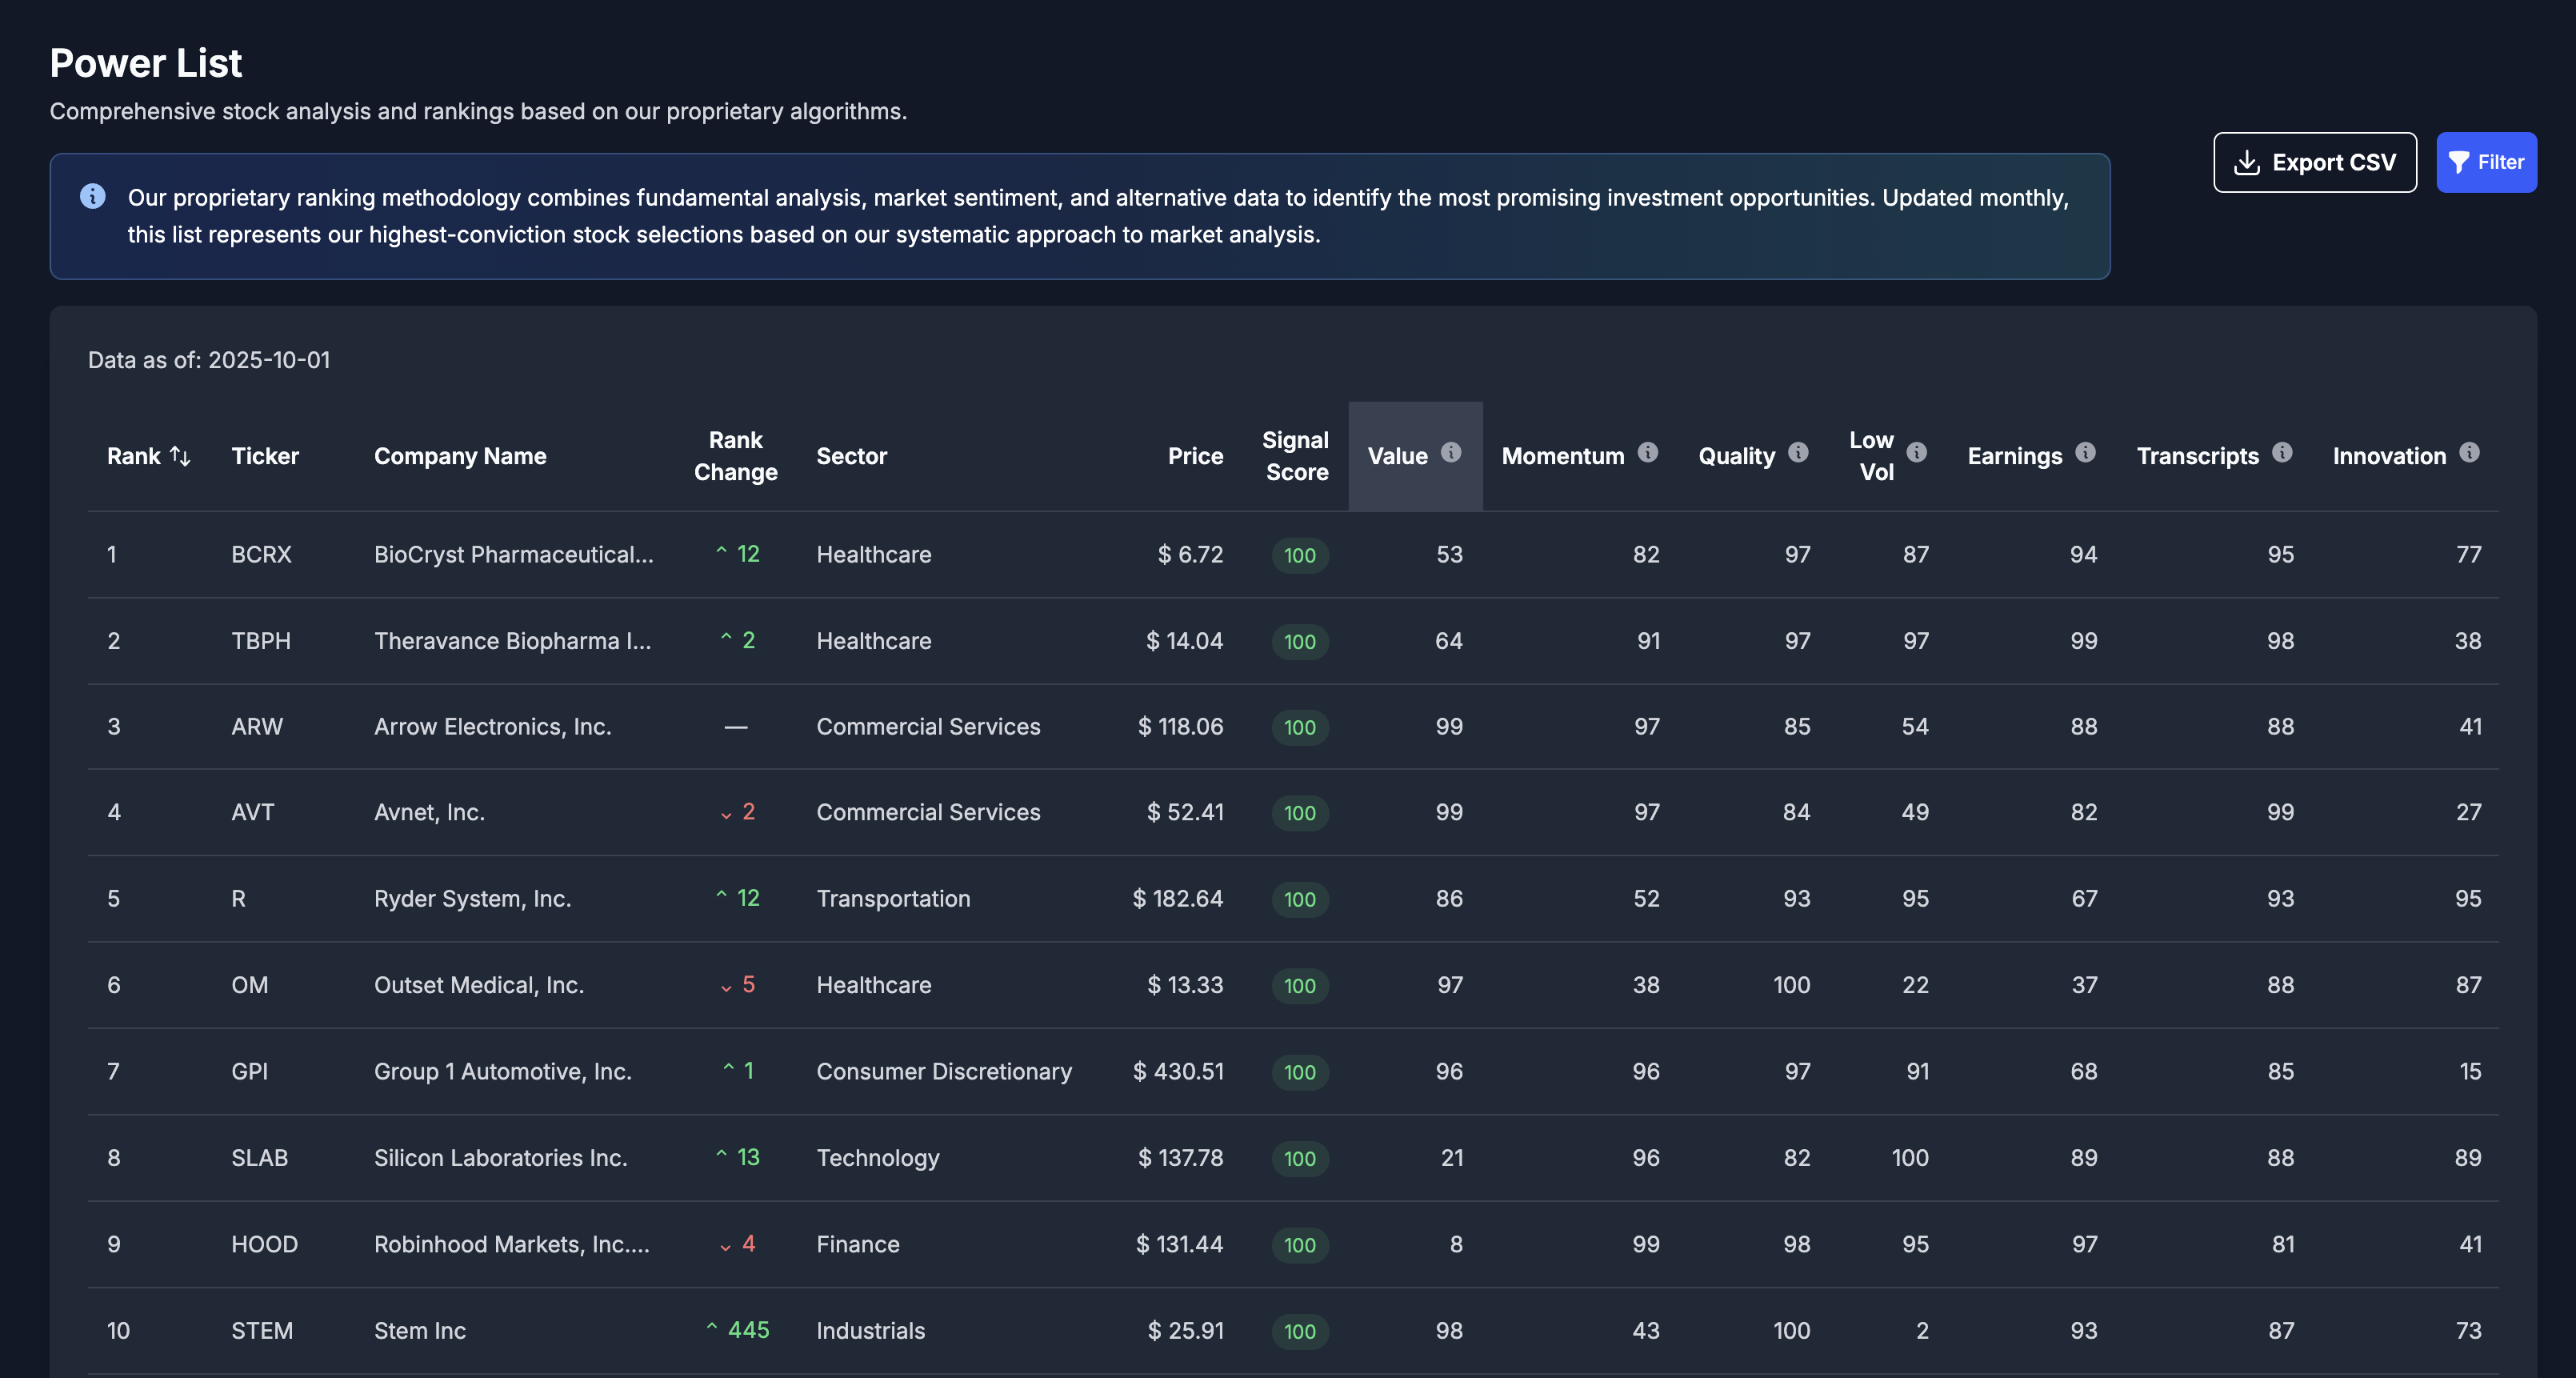
Access and screen our proprietary stock rankings.
The Advisor Time & Fee Challenge
Traditional portfolio management is consuming your most valuable resource: time. Meanwhile, high TAMP fees are eating into your practice's profitability.
42–47 hours/week spent on client meetings and preparation work
Only 7–12 hours/week remain for critical business development activities
TAMPs help reclaim this time through automation of trading, rebalancing, and research
Most TAMPs charge high fees for their services, creating significant strain on practice financials
These costs compound over time, reducing the profitability of client relationships and limiting growth potential
SharpeMetrix offers institutional-quality management at a fraction of traditional TAMP costs
Blending Quant & Alternative Data
We meticulously combine proprietary alternative data signals with enhanced quantitative factors to build portfolios designed for superior risk-adjusted returns.
Analyzes analyst quality, peer trends, and guidance to generate more accurate forward-looking EPS & Revenue forecasts.
Leverages ML sentiment analysis on transcripts to predict performance based on language nuances.
Uses patent and foreign visa (H1B) data to predict industry innovation intensity and future growth potential.
Incorporates forward-looking earnings expectations for a more dynamic valuation beyond historical ratios.
Differentially weights accruals based on sustainability, moving beyond simple earnings quality measures.
Uses proprietary peer-benchmarking with economically linked firms and captures cross-stock effects.
Adjusts volatility factor to mitigate other risks, presenting a purer measure predictive of future performance.
Actionable Strategies Tailored for Advisors
Select from our range of systematically constructed portfolios designed to meet diverse client objectives.
| Model Portfolio | Universe | Holdings | Annual Return | Excess Return | Sharpe Ratio | View |
|---|---|---|---|---|---|---|
| SPDR Equal Factor 3
ETF
| Sector Rotation | 3 | 15.9% | 2.5% | 1.05 | View Details |
| SharpeMetrix Large Cap 50 | S&P 500 | 49 | 16.9% | 4.6% | 0.92 | View Details |
| SharpeMetrix Core Alpha 50 | Russel 1000 | 49 | 17.4% | 5.6% | 0.88 | View Details |
| SharpeMetrix Small Cap Value Edge | Russel 2000 | 39 | 18.8% | 8.7% | 0.66 | View Details |
| SharpeMetrix Russell 1000 Momentum | Russel 1000 | 39 | 16.5% | 4.7% | 0.77 | View Details |
| SharpeMetrix Small Cap Edge 50 | Russel 2000 | 49 | 19.2% | 9.0% | 0.86 | View Details |
| iShares Factor Advantage 7
ETF
| Sector Rotation | 7 | 14.4% | 4.2% | 0.81 | View Details |
| SPDR Factor Advantage 3
ETF
| Sector Rotation | 3 | 15.4% | 2.0% | 1.03 | View Details |
| SharpeMetrix Large Cap Earnings | S&P 500 | 39 | 13.7% | 1.5% | 0.71 | View Details |
| iShares Equal Factor 7
ETF
| Sector Rotation | 7 | 14.3% | 4.2% | 0.81 | View Details |
| SharpeMetrix Large Cap 30 | S&P 500 | 29 | 16.6% | 4.3% | 0.88 | View Details |
| SharpeMetrix Small Cap Edge 30 | Russel 2000 | 29 | 18.6% | 8.4% | 0.80 | View Details |
| SharpeMetrix Core Alpha 30 | Russel 1000 | 29 | 17.6% | 5.8% | 0.85 | View Details |
Empower Your Practice With Systematic Portfolios
Leverage SharpeMetrix to achieve key strategic advantages for your advisory business.
Go beyond generic factors with our proprietary alternative data signals.
Benefit from robust portfolio optimization and enhanced factor definitions.
Provide institutional-grade, data-driven strategies to your HNW clients.
Leverage our ready-to-deploy models to save time on research and construction.
SharpeMetrix Power List™ Preview
See how our proprietary SharpeMetrix scores rank stocks. The top 5 positions are reserved for premium members - sign up to see what's leading the market.
Data as of: November 3, 2025
| Rank | Ticker | Company Name | SharpeMetrix Score |
|---|---|---|---|
| #1 | Premium | Premium Content - Sign Up to View | 96.4 |
| #2 | Premium | Premium Content - Sign Up to View | 96.0 |
| #3 | Premium | Premium Content - Sign Up to View | 94.8 |
| #4 | Premium | Premium Content - Sign Up to View | 93.4 |
| #5 | Premium | Premium Content - Sign Up to View | 90.6 |
| #6 | DAVE | Dave, Inc. Class A | 83.8 |
| #7 | TBPH | Theravance Biopharma Inc | 84.0 |
| #8 | AVPT | AvePoint, Inc. Class A | 80.7 |
| #9 | AEIS | Advanced Energy Industries, Inc. | 79.8 |
| #10 | HOOD | Robinhood Markets, Inc. Class A | 75.8 |
Sign up for free to see the top 5 positions and access our complete rankings of 25,000+ stocks
Join growth-focused advisors who are replacing generic models with SharpeMetrix's data-driven approach.
Launch a demo portfolio in minutes
Access forward-looking analytics instantly
Join advisors replacing generic models
Prefer to reach out directly? Visit our contact page